To measure Claude Code ROI, set a baseline from your own delivery history before access when you can, then read each usage number Claude Code reports next to a work number you already track. Settle one money question with finance before the rollout too: whether saved time counts as cost avoided or as capacity created.
Anthropic publishes guides on what to track, and its dashboards report usage and estimated spend. They do not decide how to book an hour nobody bills for. That call belongs to you, and it is easier to make before the data arrives than after it.
This post is for the CFO who asked what the company got for its seats, and for the engineering leader who has to answer. It takes the three decisions in order, then shows how one engineering team's rollout was measured without hours or dollars.
The Gnar Company, a Claude Select Services Partner, ran a four-week Immerse cohort for the five engineers at GSC Enterprises. Its case study reports three measures of that rollout.
What do you need to decide before the rollout starts?#
Three decisions make Claude Code ROI measurable, and each is easiest to settle before the first developer signs in. They are the baseline, the pairs of usage and work numbers, and the rule for counting saved time.
Engineering owns the first two, because the data sits in its systems. Finance owns the last, because it turns time into money and finance is the team that defends the result in the budget.
| Decision | Who owns it | What it produces |
|---|---|---|
| Baseline | Engineering | Delivery numbers for a set period before access, by team |
| Usage and work pairs | Engineering, with finance reading along | A short list with one usage number next to one work number |
| Saved time rule | Finance | Cost avoided, capacity created, and how to tell them apart |
Write the three answers on one page and date it. When the first report goes out, that page shows the rules were set before anyone saw a result.
How do you set a baseline before anyone gets access?#
Pull the baseline from the systems that already record delivery: source control and the ticket tracker. Anthropic's article on Claude Code costs and ROI on Google Cloud says so directly: "The baseline you need already exists: your delivery history in source control and tickets." If seats are already live, that history still holds the before numbers.
Anthropic's cost guide covers a different baseline. For estimating spend, it tells teams to "start with a small pilot group" and to "establish a baseline before wider rollout." That is a spend baseline from a pilot, and it is separate from the delivery baseline here. Take the delivery baseline before access when you can.
Pull these for each team, for the same period:
- Merged pull requests per engineer per week, for a class of work you define. A pull request is a proposed code change. Anthropic's article warns that "a typo fix and a feature release are both one PR," so it suggests counting merged PRs of a defined class: "Claude opens the PR, and a person decides whether it ships."
- Cycle time from a pull request being opened to being merged.
- Review turnaround, and review iterations per pull request.
- Review comments and rework per pull request.
- Deployment frequency and change fail rate, if you already track them.
- The backlog items each team shipped, listed by name.
- A short survey of the engineers on confidence, friction and where their time goes. Anthropic's article describes "a short survey run before and after rollout."
Pick a window that covers a normal release cycle, and note anything unusual inside it, such as a code freeze or a migration. Keep teams apart. DORA is a long running research program on software delivery and operations performance. DORA's guide to its delivery metrics says they are "best suited for measuring one application or service at a time," and that blending them across teams "can be problematic."
Why not just ask developers how much time they saved?#
Ask them, but do not let the answer stand alone. In METR's randomized study of experienced open source developers using early 2025 AI tools, developers expected AI to speed them up by 24%. Afterward they still believed it had sped them up by 20%. In fact they took 19% longer on the issues where AI was allowed.
METR is careful about what that shows. The study covered 16 developers working on 246 issues in large open source repositories they had contributed to for years. METR now says "these historical results no longer reflect the current impact of AI models on open-source developer productivity."
The point for a measurement plan is narrower than the 19% slowdown. How fast a tool feels and how fast the work moved can come apart, so a survey needs a recorded number beside it.
Anthropic's Google Cloud article splits the two the same way. Perceived time savings sit under satisfaction metrics, gathered by survey. Throughput, cycle time and review speed against a baseline sit under impact metrics. Keep them in separate columns of the report. If finance wants hours from the survey, label them as reported hours.
Which usage numbers does Claude Code report?#
Claude Code reports lines of code accepted, suggestion accept rate, daily active users, sessions, cost and tokens. They come through an analytics dashboard that depends on your plan, and through OpenTelemetry, an open source observability framework that Claude Code uses to export usage data. Both describe activity and spend. What the work was worth comes from the work numbers in the next section.
| Source | Who sees it | What it reports | Anthropic's caveat |
|---|---|---|---|
| Claude for Teams and Claude for Enterprise dashboard | Admins and Owners | Lines of code accepted, suggestion accept rate, daily active users and sessions; with the GitHub app and contribution metrics enabled, merged PRs and lines shipped with Claude Code | Contribution metrics are in public beta and cover repositories on github.com |
| Claude Console dashboard, for API customers | Roles with the UsageView permission | Lines accepted, suggestion accept rate, active users and sessions, daily spend | Spend figures are estimates for analytics purposes |
| OpenTelemetry export | Whoever runs your monitoring | Sessions, lines of code modified, pull requests and commits created, cost, tokens, active time | Cost metrics are approximations |
Anthropic's analytics guide calls the dashboard's contribution numbers "deliberately conservative" and says they underestimate Claude Code's impact. The guide adds that only lines and PRs "where there is high confidence in Claude Code's involvement are counted." Read them as a minimum.
Two details change how you read these numbers. The OpenTelemetry pull request count is the PRs Claude Code creates. Anthropic's Google Cloud article notes it is "not what eventually merges," and says source control and tickets "remain the record of what shipped." The dollar figures are estimates too. Anthropic's monitoring guide says "Cost metrics are approximations," so the cost line in the report comes from the invoice.
How do you pair each usage number with a work number?#
Put every usage number next to a work number that should move if the usage mattered. Usage shows people opened the tool, and the work number shows whether delivery changed, so the pair stops either one being read alone.
Anthropic's analytics guide suggests the same move for its contribution metrics: use them "alongside DORA metrics, sprint velocity, or other engineering KPIs." DORA has identified five delivery metrics, including change fail rate and deployment frequency.
| Usage number | Work number to read next to it | Where the work number lives |
|---|---|---|
| Sessions | Merged pull requests of your defined class, per engineer | Source control |
| Share of merged PRs with Claude Code | Review iterations and review comments per pull request | Source control and the review tool |
| Lines of code accepted | Change fail rate and rework | Deployment records and tickets |
| Spend per user | Cost per merged pull request of your defined class | The invoice and source control |
| Daily active users | Named items finished, such as an incident closed at its root cause | The ticket tracker |
The last row comes from Anthropic's own caution that not every unit of work is a PR. Its article gives "a service cutover or an incident closed at its root cause" as examples. Cost per unit of output appears in the same article as something Claude Code's telemetry lets you track or derive.
Keep the list short. DORA's guide lists "Having one metric to rule them all" among its pitfalls, and reading each usage number next to a work number answers that one. It also warns against "Setting metrics as a goal," which it says "increases the likelihood that teams will try to game the metrics." So report the numbers by team, and never turn lines accepted into a target for one engineer.
Does saved time count as cost avoided or capacity created?#
Count saved time as cost avoided only when a cost on the books or in the approved plan goes away, such as a contract not renewed, a planned hire not made or overtime no longer paid. When the same people simply have hours back, count it as capacity created, and report what the freed hours produced.
Anthropic's Google Cloud article points at the second kind. Its volume measures include "named bodies of work: the specific backlog items your teams shipped with the freed capacity."
| Cost avoided | Capacity created | |
|---|---|---|
| What it means | A cost on the books or in the approved plan goes down | The same team finishes more work |
| How to show it | The invoice, contract or hiring plan that changed | Named backlog items shipped, against the baseline |
| Who signs off | Finance | The engineering leader and the business owner of the work |
| What to avoid | Count survey-reported hours as dollars | The same hours counted again as dollars |
Decide before the rollout which one the report will use, or how it will split them. Booking the same hour as both counts it twice. If nothing on the books or in the plan changed during the period, the report has no cost avoided line, and the freed time is shown as the work it produced.
How was the GSC Enterprises rollout measured?#
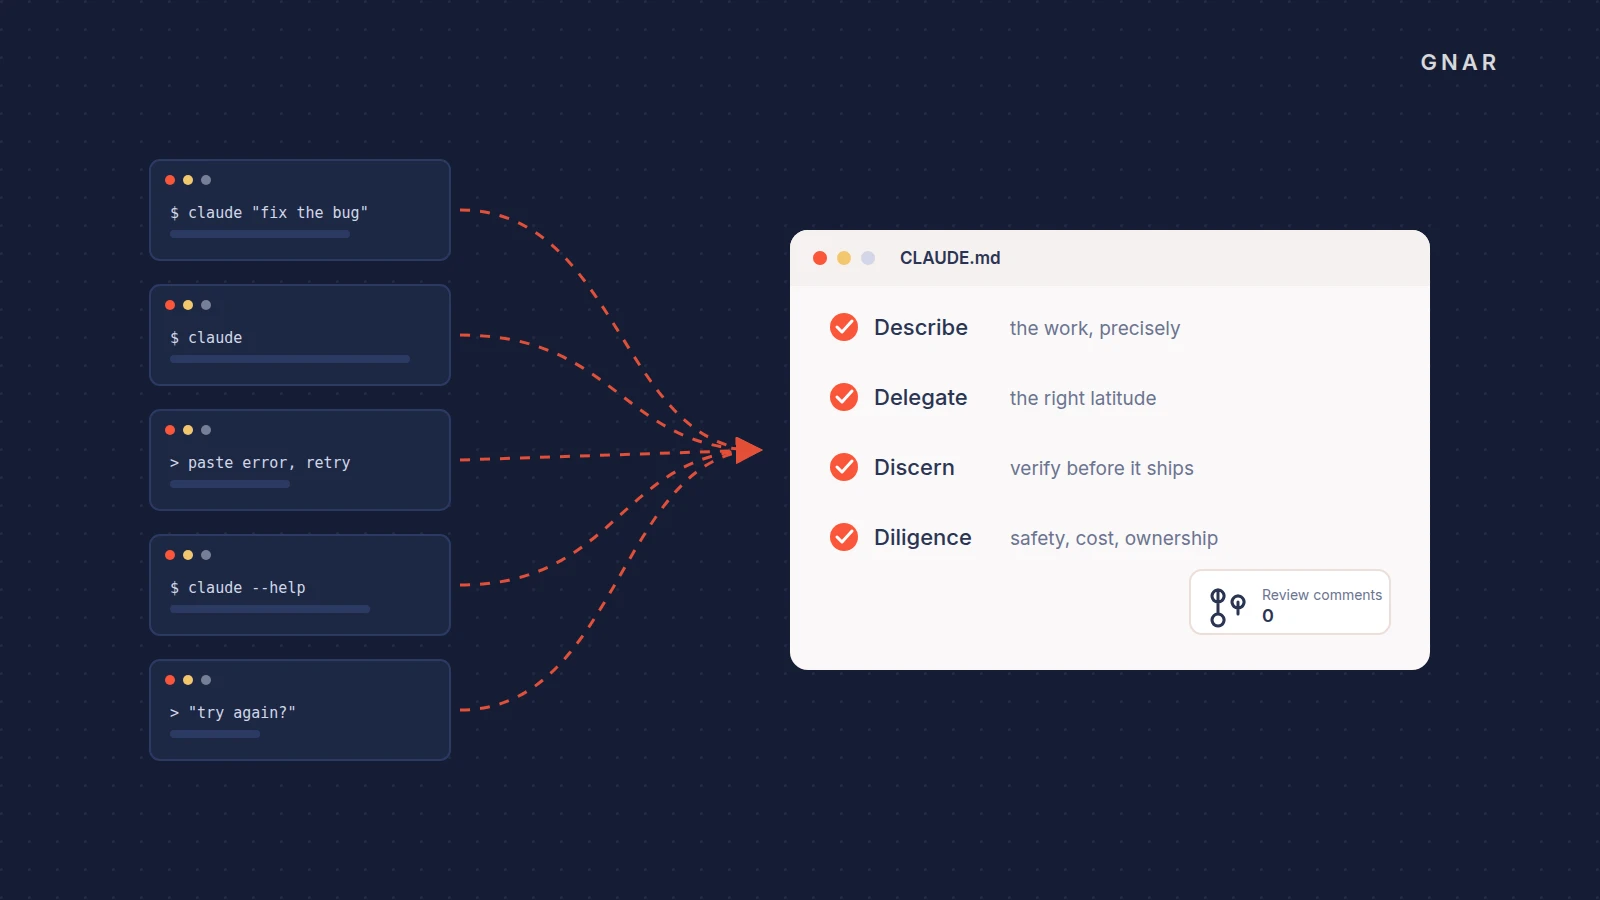
The Gnar Company's case study on GSC Enterprises measures the rollout in three ways. The first is where each engineer placed on the Immerse Four Ds (Description, Delegation, Discernment and Diligence) at intake, and where they self-assessed at close. The second is the share of pull requests an unchanged review agent commented on. The third is what each engineer left with in their own codebase. None of the three is hours or dollars.
The case study opens with the starting point: "GSC Enterprises, the wholesale distributor behind Grocery Supply Company, had already put Claude Code in the hands of its engineering team." Gnar ran a four-week Immerse cohort for its five engineers on their own production code. The three measures, as the case study states them:
| Measure | What the case study reports |
|---|---|
| Where each engineer placed at intake and at close | "All five engineers started at Direct or higher across the Four Ds." "By the end of the program, all five self-assessed at Systematize or Orchestrate on every dimension." |
| A review tool nobody changed | "PRs with review-agent comments went from roughly 100% to less than 10% over the four weeks." |
| Work in the code | "Every participant left with a merged change in their own codebase, a maintained context file, at least one reusable skill, and a workflow they can describe." |
The first measure uses the Immerse Four Ds: "Description (how precisely work is specified), Delegation (how much latitude is granted), Discernment (how output is verified), and Diligence (safety, cost, and accountability)." Each dimension is placed in one of four bands: Craft, Direct, Systematize, or Orchestrate.
The second is GSC's own independent review agent. "GSC runs an independent code review agent against every pull request." The case study says "Better up-front specification and tighter context discipline raised the quality of generated code before it reached review."
The case study reports no hours saved and no dollar figure. Its time figures describe the program itself. They are four weeks, "two 45-minute 1:1s per engineer per week", and a cohort that "fit inside a normal workweek, roughly five to six hours per engineer."
The case study's starting points were taken at the start of the cohort, after the engineers already had Claude Code. The case study says the review tool did not change over the four weeks. The placement at intake is a baseline for skill, taken at the start, and the close figures were self-assessed. The work in the code is a list of named items. In a report to the CFO, the three measures go under their own heading, next to the usage numbers, and stay out of the dollar line.
What goes in the report to the CFO?#
The report is one page with the dated decision page beside it. It shows what the company paid, how much the tool was used, what changed in the work against the baseline, and the value line written under the rules agreed before the rollout.
- Cost: seat fees and usage from the invoice, for the same period, plus training time and any implementation work. Telemetry cost is an estimate.
- Usage: active users, sessions and the share of merged PRs with Claude Code, by team.
- Work against the baseline: each pair from the table, before and after, by team.
- Value: cost avoided with the document that shows the cost went away, or capacity created as named items shipped. Hours from the survey stay off this line.
- Team practice: fluency or review measures, like GSC's, under their own heading.
- What else changed: staffing, project mix, release dates and other tools in the same period.
- Next review: the date, and what the next report will add.
If finance wants a single ratio, this post writes ROI as value minus cost, divided by cost. Use only the value lines finance agreed to count in dollars, and show the ratio next to its parts. If no value line has a dollar figure, report the value as capacity created and leave the ratio out. Give each line of the report an owner and a number.
When does outside help make sense?#
Outside help makes sense in two cases: usage is up and the work numbers have not moved, or the work you want to measure needs Claude to reach systems it cannot reach yet. Gnar has a service for each.
The first is usage that is up while the work numbers are flat, once the "What else changed" line has ruled out staffing, project mix and release dates. Gnar's AI training for engineering teams, Immerse, is "built for a small team that already has the tools but not the practice." Its measurement is built in: "Every engineer is placed at kickoff, mentored weekly, and retaken at midpoint and wrap-up. Movement is named per engineer."
The second is an integration problem. When the work needs AI to reach your ERP, CRM or databases, the connections have to be built before the work numbers can show anything. That starts with Gnar Discovery and Design. Two weeks, $15,000, and you walk out with a build plan that has a fixed price on it.
You can talk any of this through on a call with Gnar.
If your own engineers have the capacity and the direction, do it internally and we will say so on the call.