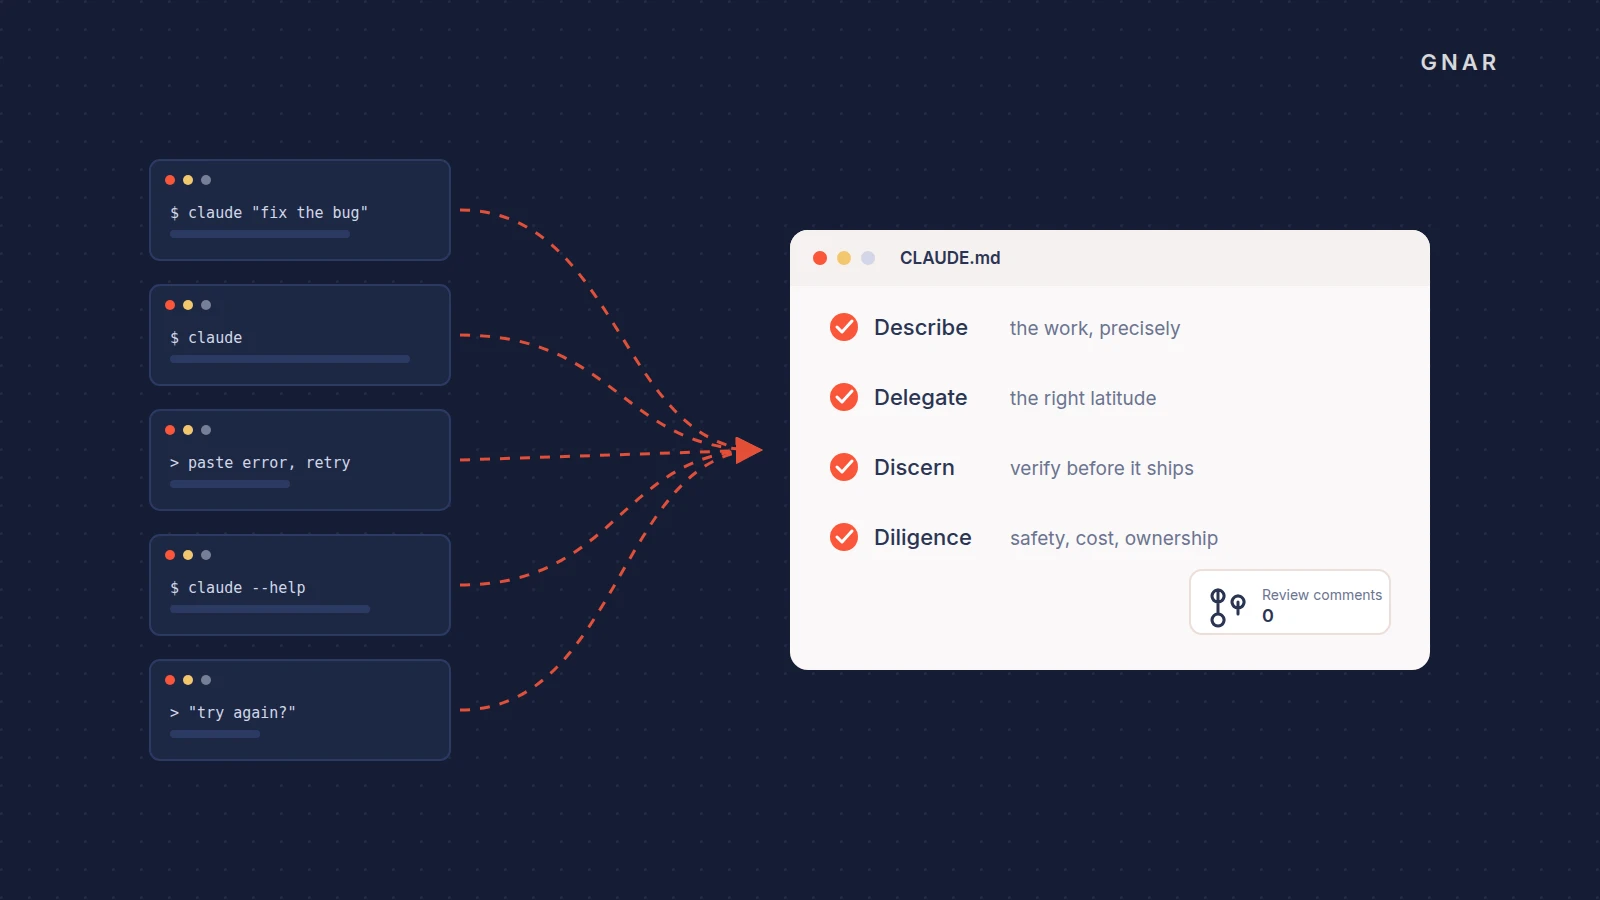
Anthropic's Claude Enterprise administrator guide names six success metrics. They are weekly active users, messages per user, feature adoption, time saved per user, user satisfaction and tasks augmented by Claude. When the guide turns to measuring impact, it adds department penetration. Of the six success metrics, three count use and three are what people report about Claude's value. Department penetration counts use too. None of them is a count of the work itself, so our advice is to put a number from the work beside each usage count in the report and to report the survey numbers under their own heading.
Anthropic's own rollout course makes the same point. It calls its adoption signals "leading indicators you act on that tell you Claude is being used, not what that use produced". Then it says: "To see what the usage is delivering, pair these signals with the outcomes of the work itself".
This post is for the CIO who reports Claude Enterprise usage to the leadership team. It takes each metric Anthropic names and says where the number comes from. It says what each one leaves out, and pairs it with a work number. Every target below is Anthropic's, labeled as Anthropic's. None of them is a Gnar result.
Some departments work mostly in systems that nobody has connected to Claude yet. One is an ERP, where orders and stock live. Another is a CRM, where customer records live. Connector use, one of the depth signals in Anthropic's course, can only count systems someone has connected. Enterprise AI integration connects an AI model, such as Claude, to the systems your company already runs. U.S.-based senior engineers at The Gnar Company build those connections. Gnar is a Claude Select Services Partner in Anthropic's Claude Partner Network.
Which adoption metrics does Anthropic name for Claude Enterprise?#
Anthropic's administrator guide lists six success metrics, each with a target and a measurement method. Three are activity metrics: weekly active users, messages per user per week and feature adoption. Three are impact metrics: time saved per user per week, user satisfaction and tasks augmented by Claude.
| Metric | Anthropic's target | How the guide measures it |
|---|---|---|
| Weekly active users | 70% of licensed seats | Admin dashboard |
| Messages per user per week | 25 or more messages | Usage analytics |
| Feature adoption (Projects, Artifacts) | 40% of active users | Feature analytics |
| Time saved per user per week | 3 or more hours | User survey |
| User satisfaction score | 4.0 or higher out of 5.0 | Quarterly survey |
| Tasks augmented by Claude | 5 or more per week | User self-report |
The same guide has a section on measuring impact. It tells admins to "Shift from tracking activity metrics to demonstrating business value". It names adoption as "active users, department penetration, feature usage," tracked "via the Admin dashboards and API". It names productivity gains as "hours saved, tasks augmented," measured "through periodic user surveys".
Our advice: read the method column as closely as the targets. Three of the six numbers come from Claude's own analytics. The other three come from people answering a survey or reporting on themselves.
What does weekly active users against seats show, and what does it not show?#
Weekly active users against seats shows how many of the seats you pay for are in use. It does not show how much each person relies on Claude, or what the use produced. One chat message in a day is enough to count a person as active.
Anthropic's Analytics API documentation defines an active user. A user counts as active for a day if any one of three things is true:
- "They sent at least one chat message in Claude".
- "They had at least one Claude Code session (local or remote) associated with your Claude Enterprise organization that included tool use or git activity".
- They had at least one Cowork session with tool use or message activity.
The admin dashboard shows the number as active members and assigned seats. The Analytics API returns "organization-level daily, weekly, and monthly active users, seat counts, and pending invites". On the Enterprise plan, analytics chat lets an admin ask in plain words. Anthropic's example question "What's our seat utilization rate?" reads this metric.
What the number leaves out follows from the definition. Take two people. One sends a single message on Monday, and the other drafts a team's month-end analysis in Claude. Both count once. Our advice: report this number as breadth, by department, and keep it next to the depth numbers in the next sections.
How do you measure department penetration?#
Anthropic's administrator guide names department penetration as an adoption measure. In this post it means the share of a department's people who are active, read group by group. Claude reports usage by group, so our advice is to start with groups that match your departments.
Anthropic's course describes active members by group as showing "Whether adoption is spread across your groups or concentrated in one". For the group view, it points to "the Analytics API by group, or the spend CSV joined to your group mapping". Anthropic's consumption guide adds a note on groups: "'Engineering' and 'Sales' are more useful than 'North America' and 'EMEA' for consumption management".
Our advice for the report: one row per department, with active members, the department's headcount and the share active. Keep assigned seats in a separate column. Use the same weeks for every department. A single company figure averages a busy department with a quiet one.
When one department's number is low, two questions come first. Can that group open Claude at all, and does it have someone to ask? Those are the first two of four checks in our post on a Claude rollout that goes quiet.
What do messages per user and feature adoption show?#
Messages per user and feature adoption show how deeply active people use Claude. Feature adoption also shows whether they use Projects and Artifacts as well as plain chats. Neither shows whether that use went to work the business cares about.
Anthropic's course sorts its signals into two kinds: "Breadth and depth measure adoption". It lists three depth signals, each with what it tells you:
- Chats per active member: "How much each active member relies on Claude".
- Skills and/or projects in use: "Whether work is compounding into workflows others reuse".
- Connector use: "Which of your tools matter and how much Claude acts inside them".
The dashboard's Chat page counts chats, while the administrator guide's target is in messages. For messages per user, use the Analytics API, whose user activity data gives "per-user daily metrics across chat (conversations, messages, projects, files, artifacts)".
The administrator guide's feature adoption metric names Projects and Artifacts. In our reading, the closest dashboard numbers are on its Chat page. They are "Percentage of users with 1 or more project" and "Percentage of users with 1 or more artifact". For connectors, Anthropic's usage analytics article says the dashboard reports "the number of users, plus counts of read and write actions".
One reporting detail can make depth look low when it is not. The course warns: "If some members have the unified Claude experience, their chat and Cowork usage is reported under Chat and Cowork unified". Add those figures in before you call a group shallow.
Connector numbers can only count tools someone has connected. A department may work mostly in an ERP or a CRM with no connector. Our advice: report its connector use as not yet possible, and do not call it low.
How reliable are hours saved, satisfaction and tasks augmented?#
Hours saved, satisfaction and tasks augmented are numbers people report. They show the value people perceive, and measured output has to come from records. Anthropic's guide measures all three by a user survey, a quarterly survey or user self-report.
As of November 2026, Claude Enterprise has a survey tool for this. Anthropic's surveys article says "Surveys are available for Enterprise plans". It also says "Surveys aren't available to organizations with a HIPAA configuration". A survey shows as a small card in chat or Cowork, and "A survey takes about 90 seconds to complete".
Two of the four default questions ask people to name a piece of work. The first asks for "the most valuable thing you've done with Claude recently" and how they could tell the outcome was better. The last asks "If your team lost access to Claude tomorrow, what would break or slow down first?" and takes a written answer. Our advice: quote a few answers to those two in the leadership report.
Two cautions apply. The consumption guide says "Responses aren't anonymous: the export includes each respondent's email". And the dashboard lists Estimated time saved under its results section, so the word estimated stays in your report too.
Our advice: put these three numbers under their own heading, labeled as reported by staff. Keep them out of any dollar figure.
Should Anthropic's targets go in the report as goals?#
Use Anthropic's targets as a reference, and set your own pace goal with your department leads. Anthropic's two sources read differently on this. The administrator guide gives targets, such as 70% of licensed seats. The rollout course says of its adoption signals: "None of these numbers are a target to manage; they're diagnostics".
The course asks admins to "Set the pace goal that will tell you, month by month, whether you're on the way there". It also says to "Finalize these checkpoints with your stakeholders rather than alone". Anthropic's Claude Cowork deployment guide makes a similar point for a pilot: "Define success before you start among relevant stakeholders".
Smart reports are a Claude tool that reads a sample of a team's transcripts. For them, Anthropic's smart reports article says they "aren't designed and should not be used for evaluating individual performance or making employment decisions".
Our advice: report targets at the company and department level, and never as a quota for one person. Write down the pace goal and the date it was agreed. Then the report reads the numbers against a goal the leadership team already saw.
Which work number goes next to each usage number?#
Put a number from the work itself next to each usage number. Examples are review turnaround, queue depth, time to a first draft or rounds of revision for the team that uses Claude. Anthropic's Claude Cowork deployment guide gives a measure like this for each of six functions it lists.
The table below copies the guide's "First Claude Cowork use cases and success measures by function". NDA means non-disclosure agreement, and PRD means product requirements document.
| Function | First use case | What Anthropic says you'd measure |
|---|---|---|
| Legal | NDA review and redline against your playbook | Review turnaround time; queue depth |
| Finance | Variance analysis with root-cause commentary | Time from close to narrative; analyst hours per cycle |
| Sales | Pre-call research and brief generation | Prep time per call; rep-reported confidence |
| Product | PRD drafting from customer feedback and analytics | Time to first reviewable draft |
| HR | Performance review drafting from rubric and manager notes | Cycle completion rate; manager time per review |
| Marketing | Campaign brief to asset draft against brand guidelines | Concept-to-review time; rounds of revision |
The next table is our advice. It pairs Anthropic's usage metrics with a work number. Hours saved, satisfaction and tasks augmented stay under their own heading as reported numbers, and the last row gives a work number to check hours saved against. Where the first table has a measure for that team, use it.
| Anthropic's usage metric | Work number to put beside it | Where the work number lives |
|---|---|---|
| Weekly active users against seats | Output of the named task the seats were bought for, such as reviews closed per week | The team's own tracker |
| Active members by department | That department's measure from the first table, counted from records, such as prep time per call for Sales | The department's queue or ticket system |
| Messages per user | Rounds of revision on the same task | The review or document tool |
| Projects, artifacts and skills in use | Time to first reviewable draft on work that starts from a shared project or skill | The team's tracker |
| Connector reads and writes | Records handled in that system, such as orders or tickets | The ERP, CRM or ticket system |
| Hours saved, from the survey | Analyst hours per cycle or queue depth, counted from records | Time records or the queue |
Our advice: take the work number for a period before Claude, as well as after, when you can. A before figure is what lets the report show a change.
What can Claude's analytics tell you about results?#
Claude's analytics count what Claude produced, such as pull requests, designs and file operations. Two parts of Claude help, the dashboard's results section and smart reports, and the consumption guide adds a skills value estimate worked out outside the product. Our advice: count the business result itself, such as a faster close, in your own systems. Back Claude's numbers with one number from a tool Claude does not report on, as the GSC Enterprises example near the end of this post does.
The dashboard has a section headed "What are the results?" with six numbers. They are PRs created, designs created, file operations, conversations, MCP writes and Estimated time saved. PRs are pull requests. MCP is the Model Context Protocol, which its own site calls "an open-source standard for connecting AI applications to external systems".
Smart reports go further. The consumption guide says "Smart reports show what that spend is producing". The smart reports article says Claude reads a sample of transcripts and "groups them into workstreams and types of outputs". The smart reports article names a budget use: "Walk into a budget conversation with a per-team view of adoption, cost, and output instead of a blended usage number". Smart reports are "available on Claude Enterprise plans and are off by default". "Each organization can run up to 10 reports per month at no charge". Organizations cannot use them with customer-managed encryption keys, a HIPAA configuration, or a hybrid deployment that runs inference on their own cloud provider.
The skills view shows use and cost, and the consumption guide adds a value estimate. It tells admins to "Assign a value per run to each skill". It calls that value "a rough estimate of what the completed task is worth". You subtract the cost per use and multiply by total uses to get the net value each skill has generated. The guide notes "The calculation currently happens outside the product".
Engineering teams get more on the dashboard's Claude Code page. Its Value tab includes an estimated productivity lift, cost per PR and cost per session. "Every formula on the Value tab is shown inline". Reading those against delivery numbers is the subject of our post on measuring a Claude Code rollout.
What do the spend numbers cover on your plan?#
The spend numbers depend on how your Enterprise plan is billed. On a usage-based plan the spend export covers the organization's full usage. On a seat-based plan, spend reports appear only with usage credits turned on, and they cover overage spend only.
Anthropic's usage analytics article gives the seat-based rule. On that plan, spend reports appear only if your organization has turned on usage credits. "The spend data covers overage spend only," and use within the seat allotments is not included. "For usage-based Enterprise plans, the export captures your organization's full usage".
The Analytics API follows the same split. "Engagement and adoption data is available on all Enterprise plans". "The cost and usage endpoints apply to usage-based Enterprise plans; for seat-based Enterprise plans, they reflect usage credits only".
Our advice: note four more limits in the report.
- Start date. "Claude Enterprise Analytics API data is available for dates on or after January 1, 2026".
- Month end. Cost values can change until about 7 days after the month ends. Anthropic's advice: "For invoicing-grade totals, query only months that ended at least 7 days ago".
- Amazon Bedrock. If your organization uses Claude Code through Amazon Bedrock, "the Claude Enterprise Analytics API does not return Claude Code activity for that usage".
- Customer-managed encryption keys. With those keys, Anthropic says some Claude Code and Cowork numbers in the Analytics API "can be zero or lower than actual use".
Who can pull the numbers matters too. "Enterprise Admins can view all analytics except Spend". "Only the primary owner of the organization can enable API access and create Analytics API keys".
What goes in the report to the leadership team?#
A leadership report on Claude Enterprise covers who uses Claude, how deeply, what changed in the work and what it cost. The overview page of Claude's analytics asks four questions in this order: "Who's using Claude?", "How are they using Claude?", "What are the results?" and "How much is Claude costing?"
The list below is our advice. Items 1, 2 and 5 follow the dashboard's first, second and fourth questions. Items 3, 4 and 6 use lines from Anthropic's administrator guide, and item 3's work number comes from your own systems.
- Who uses it. Weekly active users against seats for the company, and active members against headcount, one row per department, with the pace goal beside it.
- How deeply. Messages per user, projects and artifacts in use, and connector reads and writes, by department.
- What changed in the work. Each department's work number from the pairing table, before and after. Add what the guide calls "short case studies from team leads".
- What people report. Hours saved, satisfaction and tasks augmented, under their own heading and labeled as survey results.
- What it cost. Spend for the period, with a note on whether the plan is seat-based or usage-based.
- When it comes back. The guide suggests you "Establish a regular reporting cadence (e.g., quarterly business reviews) to keep stakeholders informed".
Analytics chat can draw the charts, and its results are scoped to your own organization. Anthropic's analytics chat article also says Claude "won't judge whether a number is good or bad for your organization". So the line in the report that says on track or behind is yours to write.
What does a work number from outside Claude look like?#
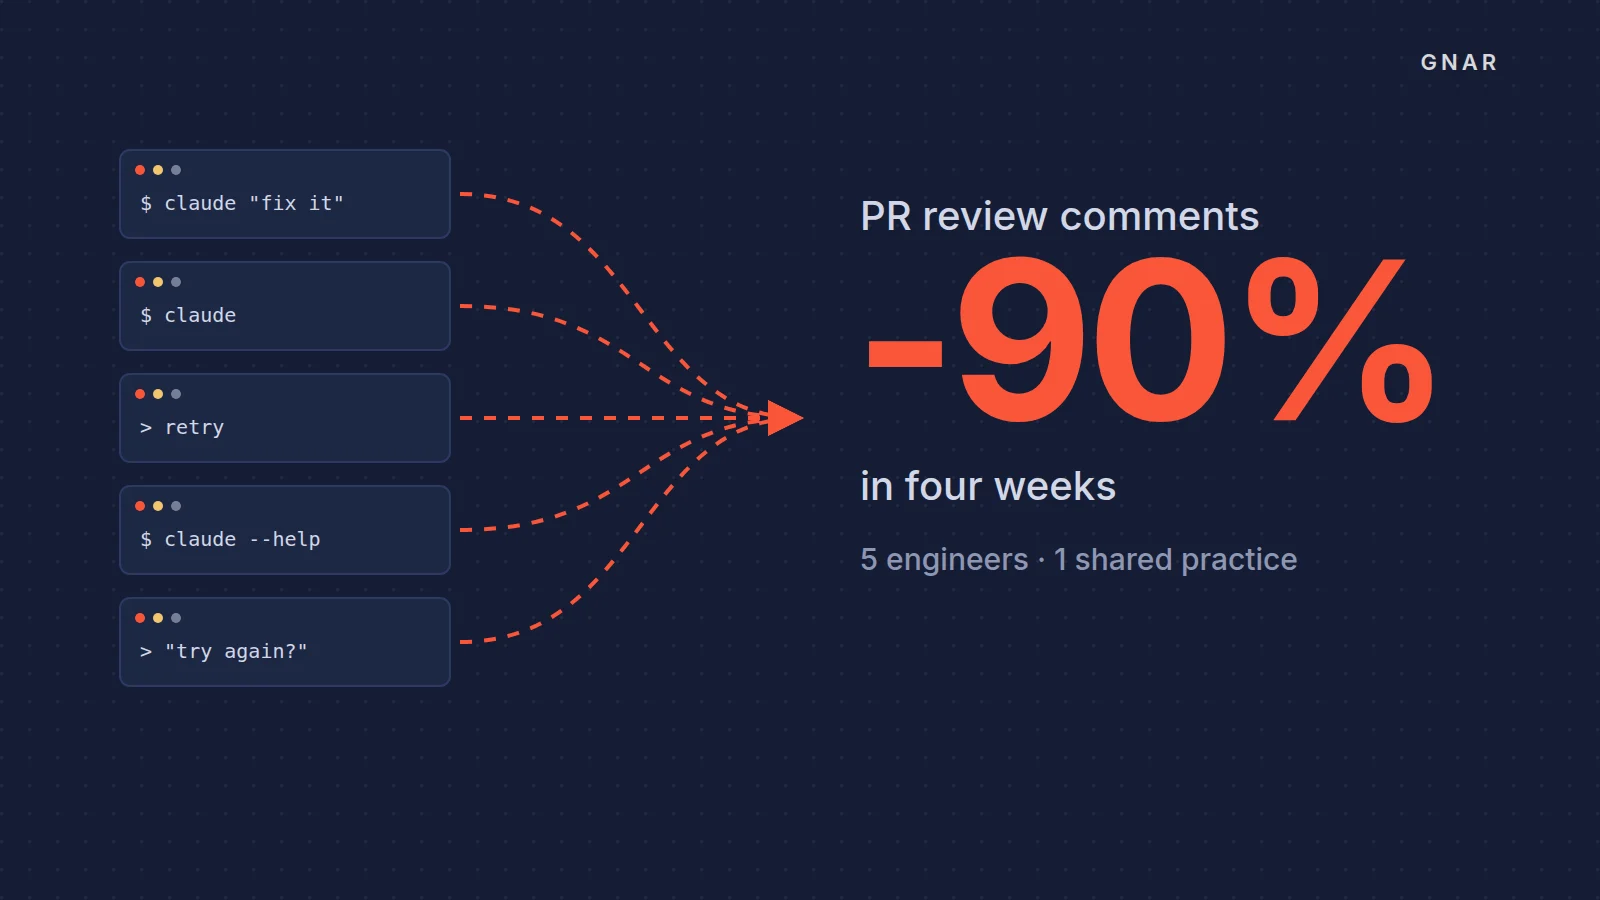
A work number from outside Claude comes from a system that records the work whether or not anyone uses Claude. At GSC Enterprises, that system was a code review agent. The case study says "GSC runs an independent code review agent against every pull request", and that tool did not change during Gnar's four-week Immerse cohort for GSC's five engineers. Over the four weeks, "PRs with review-agent comments went from roughly 100% to less than 10%".
The case covers one engineering team of five, using Claude Code. As general advice, look for one number of that kind in each department. Pick one your company already records, from a tool that stays the same during the rollout.
When does outside help make sense?#
Outside help makes sense in two cases, and Gnar has a service for each. In the first, a department's work lives in a system Claude cannot reach. In the second, an engineering team has Claude Code and no shared way to use it.
The first is an integration job. Gnar's integration page states the problem: "Your AI can't see your orders, customers or files, so people paste them into a chat by hand". On the same page: "You choose what it can see and change, and every lookup and change is recorded".
The second is a training job. Gnar's AI training for engineering teams, Immerse, is "Built for a small team that already has the tools but not the practice".
When the fix is a build, it starts with Gnar Discovery and Design. Two weeks, $15,000, and you walk out with a build plan that has a fixed price on it.
If your own engineers have the capacity and the direction, do it internally and we will say so on the call.